What is Circulating Supply in Cryptocurrency? Explained with Examples & Tools
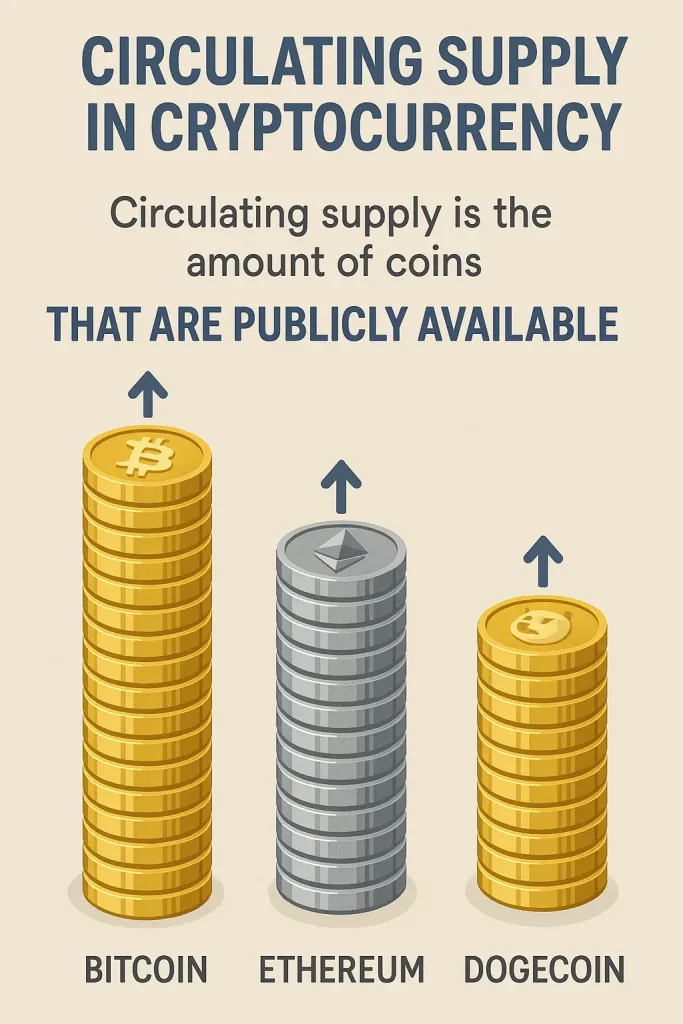
When you dive into the world of cryptocurrencies, you’ll quickly encounter the term circulating supply. It’s the number of coins or tokens publicly available and actively traded in the market. Unlike the total supply (all coins ever created) or maximum supply (the hard cap, if one exists), circulating supply reflects what’s actually in play, influencing everything from a coin’s price to its market capitalization. For example, Bitcoin’s circulating supply in 2025 is around 19.8 million BTC, a figure you can verify on platforms like CoinMarketCap. Understanding this metric helps you gauge a cryptocurrency’s value and make informed investment decisions.

Why does circulating supply matter? It’s the backbone of market capitalization, calculated as Circulating Supply × Price per Coin. If a token has 1 million coins in circulation at $10 each, its market cap is $10 million. This figure helps you compare projects and assess their market presence. Let’s explore how circulating supply works and why it’s a critical tool for your crypto journey.
Circulating Supply vs. Total & Max Supply
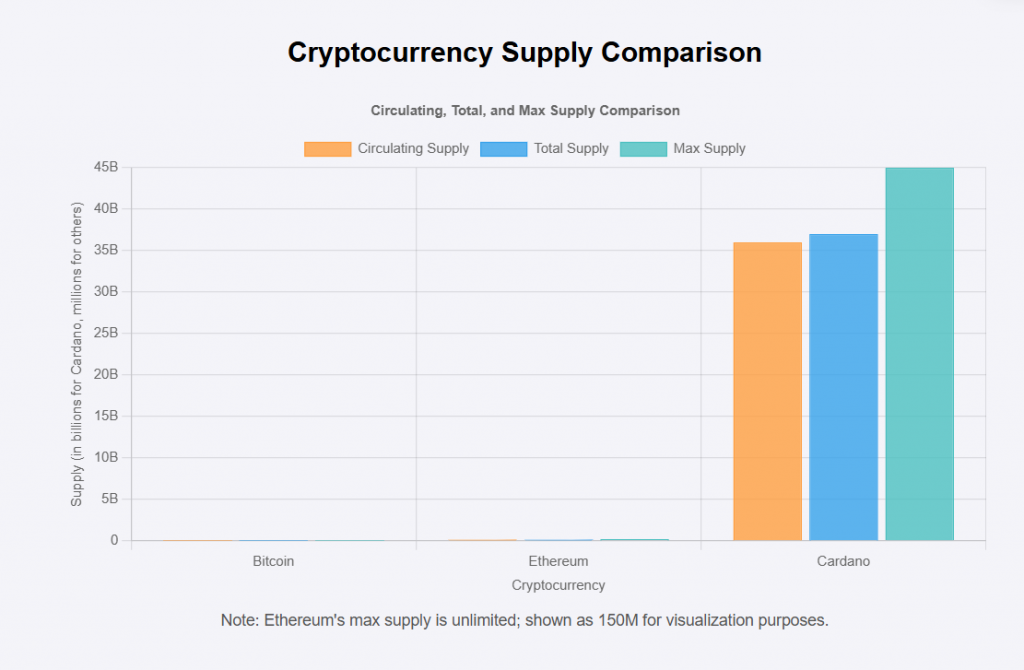
To grasp circulating supply, you need to distinguish it from total and maximum supply. Total supply includes all coins created, even those locked in staking contracts or held in reserve. For instance, Ethereum’s total supply includes ETH staked in validators, which may not be circulating. Maximum supply is the upper limit a cryptocurrency can reach, if defined. Bitcoin has a max supply of 21 million, while Dogecoin has no cap, leading to an ever-growing supply.

This distinction matters because circulating supply directly affects market dynamics, while total and max supply hint at future dilution or scarcity. When you evaluate a project, focus on circulating supply for a clearer picture of its current market impact.
How Circulating Supply Impacts Price
Circulating supply drives price through supply and demand. A lower circulating supply can increase scarcity, potentially boosting a coin’s value if demand remains strong. For example, Binance Coin (BNB) periodically burns tokens, reducing its circulating supply. Since 2017, BNB burns have removed millions of tokens, often correlating with price increases. Conversely, releasing new tokens (e.g., from vesting schedules) can dilute supply and depress prices.
Consider Ethereum’s EIP-1559 upgrade, which burns a portion of transaction fees. In 2024, over 4 million ETH were burned, reducing circulating supply and creating deflationary pressure. If you’re investing, track these events to anticipate price movements. A line chart plotting BNB’s circulating supply against its price over time would vividly show this correlation, highlighting why supply matters to your portfolio.
How Circulating Supply Is Calculated
You might wonder how circulating supply is determined. Platforms like CoinMarketCap and CoinGecko aggregate data from blockchains, exchanges, and project reports. For Bitcoin, you can check its circulating supply on a blockchain explorer like Etherscan or Blockchain, which tracks mined coins minus lost or inactive ones. However, calculations aren’t perfect. Lost coins (e.g., an estimated 3–4 million BTC in inaccessible wallets) or unreported burns can skew figures.
Verification is key. Use blockchain explorers to confirm supply data or check project whitepapers for transparency on token releases. For example, Chainlink’s circulating supply is audited to account for tokens allocated to nodes versus those in active circulation. Understanding these challenges helps you avoid misleading data when researching investments.
Where to Check Circulating Supply
To stay informed, you need reliable tools. CoinMarketCap, CoinGecko, and Messari are go-to platforms for real-time supply data. CoinMarketCap offers user-friendly interfaces and market cap rankings, while CoinGecko provides detailed tokenomics breakdowns, including vesting schedules. Messari dives deeper, offering institutional-grade data on token unlocks and project metrics.
Here’s a quick comparison:
| Platform | Strengths | Best For |
|---|---|---|
| CoinMarketCap | Simple interface, broad coverage | Beginners, quick checks |
| CoinGecko | Detailed tokenomics, free API | Investors, analysts |
| Messari | In-depth reports, token unlock data | Advanced users, researchers |
When you explore a token, cross-reference these platforms to ensure accuracy. For instance, checking Cardano’s circulating supply on CoinGecko and Messari can confirm consistency in reported figures.
Real-World Use Cases
Let’s see circulating supply in action. Bitcoin’s fixed max supply of 21 million and gradual issuance via mining create scarcity, supporting its value as “digital gold.” In contrast, Ripple (XRP) holds a significant portion of its 100 billion tokens in escrow, releasing 1 billion monthly. This controlled release keeps XRP’s circulating supply lower than its total, impacting its price stability.
Dogecoin, with its unlimited supply, grows by ~5 billion coins annually, diluting value unless demand surges. Meanwhile, Uniswap’s UNI token, used in DeFi governance, has a circulating supply shaped by community allocations and vesting. A chart comparing Bitcoin’s fixed supply curve to Dogecoin’s inflationary model would highlight how supply mechanics shape market behavior. When you analyze tokens, consider how their supply structure aligns with their use case.
Risks and Misconceptions of Circulating Supply
Circulating supply can be misleading. A common misconception is equating it with total supply, ignoring locked or reserved tokens. For example, Ripple’s escrow holdings mean its circulating supply (55 billion XRP) is far less than its total supply (100 billion). Misreading this could inflate perceived market cap.
Risks include hidden supply from token unlocks or pre-mined ICO reserves. In 2023, some DeFi projects faced “rug pulls” when teams dumped unlocked tokens, crashing prices. To protect yourself, check vesting schedules on platforms like TokenUnlocks. Also, beware of lost coins inflating reported supply—Bitcoin’s effective circulating supply is likely lower than 19.8 million due to inaccessible wallets. By understanding these pitfalls, you can make smarter investment choices.
Conclusion
Circulating supply is your key to unlocking a cryptocurrency’s market dynamics. It shapes price, market cap, and investor confidence, making it essential for your research. Use tools like CoinGecko or Messari to track supply data, and combine it with metrics like trading volume or developer activity for a fuller picture. Before investing, dig into a project’s tokenomics—check whitepapers, vesting schedules, and burn events to avoid surprises.

